Covid-19
As Covid-19 mathematical and statistical Modelling team (epidemiologists, statisticians, biologists, virologists, mathematicians, computer scientists,...) we try to predict the course of the virus and the way the course will change by taking measures or adept them. Based on the insights in different models, we advise policymakers, so they can decide on the measures that are necessary to contain or flatten the epidemic.


We all, are the numbers
If you like mathematics and statistics, the daily reports on COVID-19 and the generous supply of predictions, whether or not by experts, offers considerable food for thought. But even those who think of mathematics and statistics as very abstract disciplines, and who prefer to keep such disciplines at arm’s length, are actually in the middle of it. Each number corresponds to a son, a daughter, a partner, a granddad, a grandma, an aunt, a neighbor, a best friend,… who is infected by COVID-19 or recovered from it. In reverse, our behavior directly links to just how much chance the virus is given to spread among the population. All of us drive the figures! Our team provides the much-needed expertise around these figures.
Have a look at the data dashboard of the Belgian corona figures
As Covid-19 mathematical and statistical Modelling team (epidemiologists, statisticians, biologists, virologists, mathematicians, computer scientists,...) we try to predict the course of the virus and the way the course will change by taking measures or adept them. Based on the insights in different models, we advise policymakers, so they can decide on the measures that are necessary to contain or flatten the epidemic.
The outcome of our models always involves a degree of uncertainty, given the fact that the figures are not always measured precisely or not all data are available. The more unknown data or parameters, the larger the uncertainty and the more difficult it is to predict further into the future. Also, some models are more adept at predicting evolutions on a national level, others can give insights on a smaller scale. This means that every model is a piece of the puzzle. It requires a lot of experience in infectious diseases modeling to put all the pieces together.
Data dashboard
For our data dashboard, see here. (Note: loading the page takes a while because a lot of data is loaded and computed.)
What kind of models do we use?
Intro
Intro
We offer an abridged, simplified explanation of how various models work and what their relative strengths are. Behind the models, one finds passionate researchers at Hasselt University (headed by Prof. Niel Hens and Prof. Christel Faes) and the University of Antwerp (headed by Prof. Philippe Beutels). Jointly, they form the interdisciplinary SIMID team (www.simid.be).
Growth models
Growth models
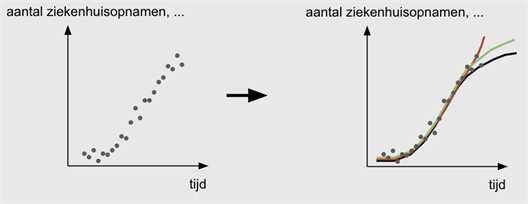
In a growth model, data on, for example, hospital admissions, number of tests, etc. are used to compute how the spread of the virus evolves over time.
Growth models let the data speak for themselves. The team examines which trends can be discerned in, for example, the number of hospital admissions that is reported on a daily basis. Do we see an increasing curve? Have we passed the peak? Is the increase exponential or is it better to model the curve logarithmically? Are there differences between men and women? What about provincial differences?...
This approach lends itself naturally to estimate how the growth factor of the epidemic changes according to measures taken, or under the influence of a changing testing strategy.
The virus holds a number of complexities in store. One of these is the difficulty in gauging the time interval between the onset of symptoms and potential hospital admission. This time interval differs from person to person. It isn’t routinely reported, but it does have an influence on what the curve looks like, and which predictions can be drawn from it.
Transmission trees
Transmission trees
![]()
In a transmission tree, we model how the virus spreads among individuals, by tracking the spread: who infects whom?
Transmission trees aim at mapping the chain of infections among people, just like new branches grow in a tree. To study where a new infection might come from, one can examine the genetic similarity of the virus among people, or we can make use of contact tracing. For COVID-19, contact tracing was applied at the onset of the epidemic to find out in which region a person could have been infected. As the epidemic gains strength and the number of infected people increases, contact tracing is no longer feasible.
Transmission trees are not at all used to accuse people who might have transmitted the viral infection. Rather, they are a wonderful tool to help estimate key characteristics of our SARS-CoV-2. These characteristics are important to find out how quickly the virus can spread and hence how urgent the need is for measures. A key quantity is the basic reproduction number (R0). When R0 falls below 1, then an infected person will typically infect less than 1 other person, in a fully susceptible population. In that case, the virus is under control. To determine R0, we need the growth rate at which the number of cases increases. One also needs information about the time lapse in a so-called infector-infectee pair (how long does it typically take between someone getting infected and then, in turn, infecting someone else). This is called the generation interval. Similarly, we need information about the serial interval, i.e., the time it takes between the infector beginning to show symptoms and the infectee to show symptoms. In addition, we need the incubation period. This information combined allows the team to estimate the chance that someone passes on the infection to someone else before showing symptoms.
Based on COVID-19 data from China and Singapore, the team was able to show that R0 is estimated to be higher when based on the generation interval, than if based on the serial interval (see here for paper). This insight is crucial, because advice towards an exit strategy should be based on the most accurate estimation possible for R0. The team showed that, because of the high risk for pre-symptomatic infection, it is very important to maintain social distance measures.
Meta-population models
Meta-population models
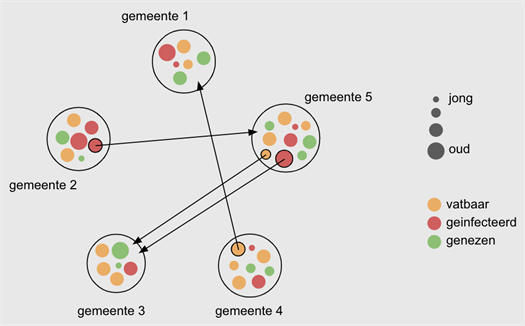
In a meta-population model, individuals, individuals are considered as inhabitants of a given town or other geographical unit. One then examines how many people in a town are susceptible or not (e.g., because they are cured), what their age is, etc. Such a model also describes which subgroups of individuals move between towns, etc.
A meta-population model is a robust, large-scale model, that allows to incorporate people’s mobility. It divides the population into groups based on age category, residence, etc. Each of these groups follows an underlying mathematical model for the spread of the epidemic. Such a model assigns people to subgroups (a.k.a. compartments): (1) susceptible people, (2) exposed people; (3) infected people, and (4) recovered people with (temporary) immunity against the virus. By mimicking interaction between such groups according to various scenarios (e.g., little or a lot of contact with people outside the household, little or ore mobility between towns,…), it is possible to predict how the number of infected people changes over time, in the short time as well as over longer time intervals.
Important sources of information are the number and the nature of social contacts of people in various age categories, the mobility patterns of people in different regions, etc.
individual-based models
individual-based models
Individual-based models
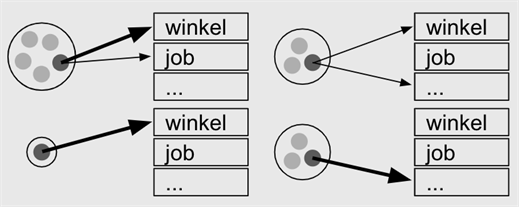
In individual-based models, people are studied in their own context. For example, household size (e.g., family with three children, a single-person household, and two families with one child), and how intense their contact are in, for example, a shop and at work.
The individual-based model (IBM), based on the number of hospitalizations, performs well in terms of: (1) describing the spread of the disease; (2) examining the consequences of relaxing the measures taken, i.e., candidate exit strategies.
In an IBM, each individual is assigned to a family, a school category, type of workplace environment, and the population at large. This assignment is guided by data available from school registries as well as employment data.
The model ‘imitates’ the behavior of individuals on a day-by-day basis. It accounts for changes in behavior on weekend days relative to weekdays, during holiday periods and, importantly, also as a result of measures taken, such as school closure and reduced social contact.
When investigating the consequences of exit strategies (e.g., reopening of schools and certain workplaces), the team also examines the added value of contact tracing to monitor and avoid new infections.
One thing is absolutely clear: relaxing all measures at once is not a good idea, because that will lead to a resurgence of the epidemic, including a new peak in the number of hospitalizations and the COVID-19 related deaths.
Compartmental transmission models based on differential equations
Compartmental transmission models based on differential equations
Compartmental transmission models based on differential equations
A compartmental model divides the population in various sub-populations between which people can migrate. These complex flows are described by a set of differential equations. There is one such differential equation per group of susceptible, exposed, infected, and recovered patients. This basic model is referred to as the SEIR model. Not in every infectious disease do modelers make use of an exposed category. However, for COVID-19 it is crucial, just because people can be infectious prior to symptom onset and/or prior to formal diagnosis. The model accommodates pre-symptomatic and asymptomatic cases, because these contribute to the spread of the infection. The differential equations describe the flow between compartments in terms of calendar time and age categories. Contact information is taken on board as well, the age distribution in the population, age-specific mortality. Based on models of this type, the team is able to estimate the basic reproduction number R0, a key quantity used to express how contagious a virus is.
![]()
Schematic representation of a compartmental transmission model that splits the population into several groups (compartments): S: "susceptible" for COVID-19, E: "exposed" to the virus, I: "infected", R: "recovered" and D: "deceased". The arrows indicate how a person can move from one compartment to another. This move is mathematically expressed a differential equations. The different I-subgroups resemble the different disease progressions of an infected person: Ipresy: presymptomatic phase in which the individual does not have any symptoms; Iasy: asymptomatic course of the disease in which the individual never shows symptoms; Imild: the individual has mild symptoms; Isev: the individual has severe symptoms with hospitalisation (Ihosp) or admission to intensive care (Iicu).
What information do we need?
It is important to realize how our own behavior influences the models’ output. Grant Anderson from the YouTube channel 3Blue1Brown created a fine movie to demonstrate what the effect is when, for example, 10% of the population does not observe the lockdown measures; or what the effect would be if infected people would immediately be quarantined, etc. Even though the models in the movie are simplifications of reality to a large extent, and make strong assumptions (e.g., everyone’s behavior is similar), the movie gives a clear feel for what is happening. Worth the watch! https://www.youtube.com/watch?v=gxAaO2rsdIs
What comes out of epidemiological model depends largely on the value or distribution of key epidemiological quantities. For example, in the individual-based model: How often does one go to the grocery store and to what extent does a person talk to other people? In the meta-population model: What fraction of the people in a given town can be considered immune because they already got the disease and recovered? Which groups move between different towns?
Such parameters are entered into the models to investigate the effect of potential measures. For a number of parameters, a range of values can be assumed, so that a good picture emerges regarding the impact of measures, to variable degrees. But how do we get reliable information about the parameters? Based on the survey in which you participate on Tuesdays, we gather a good picture regarding how many people develop symptoms, what age category they belong to, their gender, their contact patterns, etc. The more people participate in the survey, the more accurate the results are. A link to the survey at the University of Antwerp website: https://www.uantwerpen.be/nl/projecten/corona-studie/ (red button). At this website you can find interactive graphics on this particular data: https://corona-studie.shinyapps.io/corona-studie/.
In the context of the international EpiPose project (referring to efforts to pause the COVID-19 epidemic), an online survey was started in the United Kingdom, the Netherlands, and Belgium, to monitor the frequency and type of social contacts at various time points and for a range of ages. The first Belgian results are expected on April 23, 2020. On http://www.socialcontactdata.org, social contact data from various countries are shared. Evidently, internationally sharing data can help counteract the COVID-19 pandemic (see here for paper).
Further, we use hospital-reported data, such as the number of beds taken, the number of intensive care units in use, etc. For the compartmental transmission models, it is important to know how many people have acquired immunity against COVID-19 because they already went through a disease episode, perhaps unbeknownst to them. The number of confirmed cases is unquestionably an underestimate of the number of people with acquired immunity. Serological studies are being undertaken in Belgium to quantify the population’s immunity; they are based on blood samples collected as part of routine care (i.e., not specifically for COVID-19, but rather in the context of, for example, routine pregnancy monitoring). The SIMID team provides advice regarding the design and analysis of a serological study. To be precise, the study team calculates sample sizes per age category so that age-specific infection rates can be estimated with sufficient precision. Our ‘in house’ immunologist Joris Vanderlocht provides the required immunity know-how; the team also counts on the expertise of Johan Neyts (KU Leuven) and his research group. This is important to examine how the epidemic would evolve in case antiviral products would be available for administration to patients. Antiviral medicinal products slow the virus down in an infected person, so that infectiousness would decrease. The team tested the effect of antiviral means based on simulation models that simulate the viral spread (similar in spirit to the transmission model used in the meta-population context) when also contact tracing is applied. In other words, in this scenario, it is assumed that we know with whom the infected person was in contact, and that each one of these people in turn is followed for symptoms; isolation, quarantine, and/or whether a COVID-19 test are also parts of this strategy. Recent results indicate that powerful antiviral means combined with intensive contact tracing can be effective to get the epidemic under control and to keep it under control (see here for paper). This follows from the fact that, in such a scenario, there are less infections and less local resurgences of the virus than what would be seen if there were no antiviral means.
This approach is based on a number of assumptions regarding the actual behavior of the virus (e.g., how long lasts the incubation period, what fraction of infected people becomes symptomatic) and regarding the activity and availability of antiviral means. Clinical trials are ongoing to this end.
Figure from Torneri and Libin et al. (2020, MedRXiv preprint). On the Y-axis we see the total number of infections in a simulated population of 500 people. The X-axis displays various levels at which contact tracing is possible (the higher the value, the more contact tracing data are available). The colors refer to various scenarios for which the number of infections is calculated: yellow for the scenario without antiviral products and without testing when symptoms manifest themselves; green for the scenario without antiviral means but with testing when there are symptoms; blue for the scenario where antiviral medication is administered upon a positive COVID-19 test.
Calculation of disease burden and economic impact
Researchers from the University of Antwerp take the lead in the analysis of COVID-19’s impact on the burden on the health care system as well as on the economy (see paper and opinion piece). At the site www.covid-hcpressure.org, the burden for various countries is updated every hour, based on a compound capacity measure that takes into account, among others, the number of physicians, nurses, and intensive care units, relative to the number of COVID-19 cases and deaths. Various scenarios are considered when calculating the disease burden in an effort to quantify the impact of measures taken.
The economic impact in a number of European countries is being followed using media reports and market indicators across various sectors, intervention of the central banks, and data regarding employment, public finance, sales data, etc. At European level, also data on interventions by the European Central Bank are taken into account.
A hotspot for clinical trials
The statisticians at the Data Science Institute at Hasselt University are grouped in the research group CenStat. This group, in turn, is the UHasselt entity of the Interuniversity Institute for Biostatistics and statistical Bioinformatics (I-BioStat; www.ibiostat.be), a joint venture with KU Leuven. The Leuven entity, termed L-BioStat, is active in the clinical studies side of the fight against COVID-19. This comes to no surprise, given the proximity of the UZ Gasthuisberg
At KU Leuven, the DAWN (Direct Antivirals Working Against nCoV) consortium was founded that coordinates all studies towards COVID-19 therapy. Within the consortium, various therapies are investigated in a parallel fashion. First and foremost, it is explored whether known therapies, such as Itraconazole or Azithromycine, can suppress viral replication. It is further studied how hyper-inflammation, frequently observed in COVID-19 patients, can be avoided. Finally, certain studies are targeted at investigating whether reconvalescent plasma obtained from recovered COVID-19 patients can help new patients towards faster recovery. Most studies are conducted in collaboration with other partners, such as the Red Cross, the KCE, but the coordination always rests with a Leuven-based expert, such as Geert Meyfroidt.
Geert Verbeke, head of L-BioStat, represents the institute in the consortium’s steering committee. His team supports the DAWN consortium in the preparation of study protocols, the calculation of sample sizes, the development of randomization schemes, the analysis of interim data to support the Data Monitoring Committee (DMC), as well as negotiations with external partners such as the Federaal Agentschap voor Geneesmiddelen en Gezondheidsproducten (FAGG). IN addition, the team provides advice to clinical experts regarding the choice of study design and primary endpoint.
Who does what?
The COVID-19 modelling team encompasses researchers from Hasselt University (CenStat, DSI) and the University of Antwerp (CHERMID, Vaxinfectio) who jointly constitute the interuniversity SIMID group (www.simid.be). They collaborate with researchers from various partners in Belgium as well as with international partners within the context of the EpiPose consortium (EU H2020 funding, project number 101003688). CenStat (UHasselt) and L-BioStat (KU Leuven) together form the inter-universitary I-BioStat (https://ibiostat.be).
COVID-19 Modelling team
COVID-19 MS research
COVID-19 Modelling team
Main coordination
Prof. dr. Philippe Beutels, UAntwerp
Prof. dr. Niel Hens, UHasselt and UAntwerp
Growth models
Prof. dr. Christel Faes, UHasselt
Dr. Eva Santermans, Galapagos and UHasselt (*VWM)
Dr. Yannick Vandendijck, Janssen Pharma and UHasselt (VWM*)
Transmission trees
Cécile Kremer, UHasselt
Tapiwa Ganyiani, UHasselt
Meta-population-models
Dr. Pietro Coletti, UHasselt
Dr. Pieter Libin, UHasselt
Oana Petrof, UHasselt
Individual-based models
Dr. Lander Willem, UAntwerp
Oana Petrof, UHasselt
Elise Kuylen, UAntwerpen and UHasselt
Compartmental transmission models based on differential equations
Prof. dr. Steven Abrams, UHasselt and UAntwerp
James Wambua, UHasselt and UAntwerp
Dr. Eva Santermans, Galapagos and UHasselt
Corona-survey
Prof. dr. Philippe Beutels, UAntwerp
Prof. dr. Niel Hens, UHasselt and UAntwerp
Koen Pepermans, UAntwerp
Prof. dr. Pierre Van Damme, UAntwerp
Prof. dr. Thomas Neyens, UHasselt and KULeuven
Dr. Lisa Hermans, UHasselt
Jonas Crèvecoeur, KULeuven
Oluwafemi Olusoji, UHasselt
Maren Vranckx, UHasselt
Dr. Anna Ivanova, UHasselt
Prof. dr. Marc Aerts, UHasselt
Prof. dr. ir. Jan Aerts, UHasselt
Calculation of disease burden and economic impact
Prof. dr. Philippe Beutels, UAntwerpen
Frederik Verelst, UAntwerpen
Elise Kuylen, UAntwerpen
Multi-scale modelling of pharmacological intervention impact on disease transmission
Andrea Torneri, UAntwerpen
Joris Vanderlocht, UHasselt
Data preparation
Dr. Sereina Herzog, UAntwerp
Signe Mogelmose, UHasselt
Website text and figures
Dr. Sarah Vercruysse (Dutch version)
Dr. Bieke Vanhoutte (English version - Epipose)
Prof. dr. Geert Molenberghs (English version)
Prof. dr. ir. Jan Aerts (figures)
Internal coordination (in alphabetical order)
- Jan Aerts, director Data Science Institute UHasselt
- Philippe Beutels, director CHERMID, co-chair SIMID, UAntwerp
- Christel Faes, head of Research Group Mathematics UHasselt
- Niel Hens, director of Center for Statistics, UHasselt; co-chair of SIMID, UHasselt and UAntwerp; vice-director DSI UHasselt; member of GEES
- Geert Molenberghs, director of Interuniversity Institute for Biostatistics and statistical Bioinformatics, UHasselt and KU Leuven
- Bieke Vanhoutte, project coordinator, UAntwerp
- Geert Verbeke, director of Leuven Institute for Biostatistics and statistical Bioinformatics, KU Leuven
- Sarah Vercruysse, project coordinator, UHasselt
*VWM = "vrijwillig wetenschappelijk medewerker" voluntary research assistant
COVID-19 MS research
Liesbet Peeters, UHasselt
Lotte Geys, UHasselt
Ashkan Pirmani, UHasselt
Team Biosketches
Prof. dr. Steven Abrams
Prof. dr. Steven Abrams
Steven Abrams holds a bachelor degree in mathematics (2009), a master degree in statistics (Epidemiology and Public Health Methodology) (2011) and a PhD degree in statistics (2015) from Hasselt University. He has worked on modelling individual heterogeneity in the acquisition of infectious diseases using so-called frailty models. More specifically, his primary research interest is the quantification of unobserved heterogeneity in susceptibility to infection, infectiousness upon infection and social contact behavior, sources which are all relevant for the spread of infectious diseases and the control of emerging infections. Furthermore, his research interests include the statistical analysis of (serial-) serological survey data, outbreak risk assessment in highly vaccinated populations, estimation of epidemiological parameters with regard to malaria infection and the application and integration of survival data techniques in infectious disease epidemiology. Steven Abrams teaches introductory topics in statistics and mathematical modeling to bachelor students in mathematics and biomedical sciences, and to master students in biomedical sciences. He also gives statistical consultancy training to master students in statistics.
Prof. dr. ir. Jan Aerts
Prof. dr. ir. Jan Aerts
Jan Aerts received a master's degree in bioscience engineering from KU Leuven in 1998 and a PhD degree in the field of genomics (2005) from Wageningen University in the Netherlands. As a genomics-researcher and bioinformatician, he contributed to the chicken genome sequencing project, the cattle genome sequencing project and different large genomics projects in human (incl the 1000 Genomes Project) as he held different positions at the Roslin Institute in Scotland, and the Wellcome Trust Sanger Institute in England. He moved into the field visual analytics in 2010 when he took an assistent professorship in bioinformatics at KU Leuven, Belgium. Since the start of 2019, he is full professor at UHasselt, where he heads the new Data Science Institute.
Prof. dr. Marc Aerts
Prof. dr. Marc Aerts
Marc Aerts holds a master degree in mathematics (1981) and a PhD degree in statistics (1988) from Hasselt University. He published methodological and applied work on non- and semiparametric estimation (kernel estimators, splines, semi-parametric mixture models), goodness of fit (in general multivariate data models as well as censored data models), inference (bootstrap, multi-model inference), missing data models and methods, mathematical and statistical models for infectious diseases, quantitative risk assessment (chemical, microbial, toxicological), meta-analysis of diagnostic tests. Marc Aerts teaches introductory and advanced courses in the Faculty of Applied Economy, School of Information Technology, School of Transportation Sciences, and the Master of Statistics in the Faculty of Sciences. Finally, he serves as statistical consultant for the industry, academia, government and regulatory agencies.
Prof. dr. Philippe Beutels
Prof. dr. Philippe Beutels
Philippe Beutels holds Ba-Ma degrees in Commercial Engineering (1993), and a PhD in Medical Sciences (2002) from UAntwerpen. His main research interests include mathematical models of infectious diseases, social contact patterns as drivers of infectious disease transmission, the economic impact of infectious diseases, cost-effectiveness of vaccines and prioritisation of health care interventions. He started a fruitful collaboration on social contacts and mathematical models with UHasselt's Center for Statistics in 1997. He spent two years (2003-2005) as a postdoctoral researcher on infectious disease modelling and health economics at the University of Sydney and the University of Technology at Sydney (UTS), Australia. Upon returning to Belgium, he was a lead partner in the EU research project POLYMOD. In 2007-2008 he created the inter-university SIMID project (www.simid.be) and at the UAntwerp he incepted a new multidisciplinary centre, CHERMID (Center for Health Economics Research & Modeling Infectious Diseases, see https://www.uantwerpen.be/en/research-groups/chermid/ ). In a spirit of continuous stimulation between disciplines, this has led to considerable developments of methodology and policy applications. Philippe Beutels is internationally one of the most prolific and cited authors on the economics of infectious diseases. He’s been a frequent advisor for the World Health Organization (WHO) and the main senior author of the WHO guide on economic evaluation of vaccines. He led/leads workpackages on “economic evaluation” of several large European projects, is a member of Belgium’s Superior Health Council and was the first recipient of a prize for health economics research awarded by the Royal Academy in Belgium, in 2017. He’s currently Full Professor, director of CHERMID and chairperson of the Vaccine and Infectious Disease Institute at UAntwerpen.
Dr. Pietro Coletti
Dr. Pietro Coletti
Jonas Crevecoeur holds a MSc degree in mathematics and a MSc degree in actuarial and financial mathematics from KU Leuven. Since 2016, Jonas has been conducting PhD research in actuarial science at KU Leuven, under the supervision of Katrien Antonio. His research interests include the statistical analysis of reporting delay (focus on correcting delays for holiday and weekend effects) and discrete time multi-state models.
Dr. Jonas Crèvecoeur
Dr. Jonas Crèvecoeur
Jonas Crèvecoeur holds a MSc degree in mathematics and a MSc degree in actuarial and financial mathematics from KU Leuven. Since 2016, Jonas has been conducting PhD research in actuarial science at KU Leuven, under the supervision of Katrien Antonio. His research interests include the statistical analysis of reporting delay (focus on correcting delays for holiday and weekend effects) and discrete time multi-state models.
Prof. dr. Christel Faes
Prof. dr. Christel Faes
Christel Faes received the MSc degree in mathematics (2000) from the University of Antwerp and the PhD degree in biostatistics (2004) from Hasselt University. Her research interests include the statistical analysis of clustered and hierarchical data (non-Gaussian data in particular), spatially correlated data (both lattice data and geostatistical data), multivariate data of mixed types and flexible estimation methods (pseudo-likelihood, variational inference methods, INLA) with applications in risk assessment, veterinary epidemiology, health surveys, and infectious diseases. Christel Faes teaches introductory topics in statistics and mathematical modeling to bachelor students in mathematics and biology, as well as advanced topics (Bayesian methodology, spatial epidemiology, multivariate data, microbial risk assessment) to master students in statistics.
Dr. Tapiwa Ganyani
Dr. Tapiwa Ganyani
Tapiwa Ganyani obtained a bachelor degree in Statistics (2010) from the University of Zimbabwe and a master degree in statistics (2014) from UHasselt. He started a PhD in statistics at UHasselt in 2014 under the supervision of Christel Faes and Niel Hens. His main research area is epidemic modelling. He has done research on modifying bi-linear mass action when estimating epidemic parameters. He also serves as a statistical consultant at I-BioStat. In different projects, he has applied concepts of design of experiments, sample size calculation, anova, mixed models as well as multivariate methods, and, he has also developed applications using R Shiny for non-statisticians. He also serves as a teaching assistant for the Master of Statistics Distance Learning program; he is part of the teaching team for the courses Survey methods and Concepts of Bayesian Inference.
Prof. dr. Niel Hens
Prof. dr. Niel Hens
Niel Hens received a master degree in mathematics (1999) from KU Leuven and a master of science and PhD degree in biostatistics (2005) from Hasselt University. Since 2009 he is holder of the chair of evidence-based vaccinology at the University of Antwerp. He published work at the intersection between statistics and mathematical epidemiology focussing on semi-and non-parametric methods for handling missing data in his PhD work and after mainly focussing on bridging the gap between mathematical and statistical methods in infectious disease epidemiology. Next to biostatistics, Niel Hens teaches courses on computational biology and mathematical epidemiology to master of statistics and master of epidemiology students both in Antwerp and Hasselt. He is frequently consulted by federal and Flemish authorities especially for health-related topics.
Dr. Lisa Hermans
Dr. Lisa Hermans
Lisa Hermans received a bachelor degree in mathematics (2010) from Hasselt University, a master degree in statistics (2012) from the University of Leuven and a PhD degree in sciences: statistics (2019) from Hasselt University. After graduation in 2012, she started as a teaching assistant at Hasselt University. As a PhD student she worked under the supervision of promotor, Geert Molenberghs, and co-promotor, Marc Aerts. Her research includes the statistical analysis of clustered data, missing data and pseudo-likelihood estimation. Since October 2019, she works as a postdoctoral researcher in the team of Prof. dr. Niel Hens. The research is focused on modelling infectious diseases and the development of data sciences tools in forecasting epidemic diseases like influenza. She teaches mathematics and introductory courses in statistics to bachelor students in medicine and (behavioral) sciences.
Dr. Sereina Herzog
Dr. Sereina Herzog
Sereina Herzog completed her studies at three different Swiss universities: BSc in Mathematics at the University of Basel (2006), MSc in Mathematics at the University of Zurich (2009), and PhD at the University of Bern (2012). From 2013-2018 she worked as a university assistant at the Medical University of Graz (Austria) where her tasks included, besides teaching students in biostatistics, statistical analysis and planning of clinical studies in various fields of medicine. Since 2018, she works at the University of Antwerp being involved in the further development of analysis methods for infection data, e.g. serological data, using mathematical and statistical models. Her research interest focuses on how mathematical models can be implemented as early as at the planning stage of infectious disease studies.
Dr. Anna Ivanova
Dr. Anna Ivanova
Anna Ivanova received her master degree in mathematics (1998) from Brest State University (Belarus), a master degree in statistics (2004) from KU Leuven and a doctoral degree in biomedical science (2018) from KU Leuven. Her research interests are with the modeling of repeated, overdispersed and multivariate ordinal data and with missing data analysis using classical techniques applied to ordinal data -a less investigated data type- and more alternative techniques involving pseudo-likelihood. She has also been teaching short courses on basic statistics and practice sessions using different statistical packages (R, SAS, SPSS). She is currently teaching introductory courses on statistics at KU Leuven’s medical school as well as a statistical software course in the master of statistic programme at UHasselt. She is also a statistical consultant in repeated data analysis of Gaussian and non-Gaussian type at both universities.
Cécile Kremer
Cécile Kremer
Cécile Kremer received her master degree in psychology (2015) from Maastricht University. In 2017, she obtained her master degree in Statistics (Epidemiology and Public Health Methodology) at Hasselt University. She then started a PhD (2017) under the supervision of prof. dr. Niel Hens. Her research primarily focuses on transmission of HIV and HIV/HCV coinfection in high-risk populations. She also serves as a statistical consultant at CenStat.
Elise Kuylen
Elise Kuylen
Elise Kuylen holds a Master’s degree in Philosophy (2011) and Computer Science (2017) from the University of Antwerp. She is currently conducting a joint Phd in Computer Science (UHasselt) and Medical Science (University of Antwerp) under the supervision of prof. dr. Niel Hens, prof. em. dr. Jan Broeckhove, and prof. dr. Jori Liesenborgs. Her main focus is on the use of individual-based models to include heterogeneous behaviour (such as the clustering of unvaccinated individuals) into models for the spread of infectious diseases.
Dr. Pieter Libin
Dr. Pieter Libin
Pieter Libin holds a master in informatics (2014) and a PhD in computer science (2020) from the Vrije Universiteit Brussel. In his PhD research, he investigated the use of reinforcement learning to mitigate epidemics. His main research interest lies within the use of machine learning techniques in combination with epidemiological models to study prevention strategies. He has worked on different pathogens, including HIV, the hepatitis C virus, influenza, Dengue virus and Zika virus. Pieter is currently working on the EpiPose project, to model the COVID-19 pandemic with the objective to evaluate prevention strategies.
Kirsten Maertens
Kirsten Maertens
Kirsten Maertens holds a master degree in Biomedical Sciences (2012), a master degree in Epidemiology (2015) and a PhD in Medical Sciences (2017) from the University of Antwerp. Currently, she is working as a postdoctoral researcher at the Centre for the Evaluation of Vaccination at the University of Antwerp. Her research is mainly focused on the area of maternal immunization where she is involved in several ongoing national and international clinical trials focusing on several aspects of maternal immunization; e.g. immunogenicity, safety, effect on breastmilk and coverage studies. She teaches courses on Clinical Drug Research and Vaccination in pregnancy to master students biomedical sciences and students from the LIVE master in Vaccinology. She is also member of the working group Vaccination in Pregnancy from the Superior Health Council.
Signe Møgelmose
Signe Møgelmose
Signe obtained a master’s degree in demography from the University of Southampton (2016) and a master’s degree in statistics (specialized in biostatistics) from KU Leuven (2018). She is currently a PhD student under the supervision of Prof. Niel Hens. Her research primarily focuses on the incorporation of demography in models for infectious disease transmission.
Prof. dr. Geert Molenberghs
Prof. dr. Geert Molenberghs
Geert Molenberghs holds a master degree in mathematics (1988) and a PhD degree in biostatistics (1993) from the University of Antwerp. He has worked on repeated measures of a Gaussian and non-Gaussian type (binary, categorical, and count data in particular), including on mixed models and semi-parametric methods such as generalized estimating equations. He has done research on missing data methodology for analysis and sensitivity analysis. He has also contributed to methods for the evaluation of surrogate endpoints in the context of clinical trials. Geert Molenberghs teaches introductory and advanced courses in such programs as medicine, oral health, statistics, and epidemiology. Jointly with Geert Verbeke, he has taught over 100 short courses worldwide on longitudinal and incomplete data, as well as surrogate endpoints. Finally, he often serves as statistical consultant for the industry, academia, government, and regulatory agencies.
Prof. dr. Thomas Neyens
Prof. dr. Thomas Neyens
Thomas Neyens is an Assistant Professor (L-BioStat, KU Leuven; CenStat, UHasselt). He holds master degrees in biology (2007, University of Antwerp) and statistics (2011, UHasselt), and a PhD degree in biostatistics (2015, UHasselt). His research expertise lies in the field of spatial data analysis, with an emphasis on preferential sampling models, disease mapping, and biodiversity analysis. He has developed methodology in the context of spatially discrete and continuous data, point processes, and sampling bias corrections. Thomas teaches statistics at graduate and undergraduate levels, and he co-leads the FLAMES (Flanders' training network for methodology and statistics) at KU Leuven. He currently leads the statistical analysis of the weekly Belgian corona study survey, which has been designed by the University of Antwerp, in collaboration with UHasselt and KU Leuven.
Oluwafemi Olusoji
Oluwafemi Olusoji
Oluwafemi Daniel Olusoji holds a bachelor in statistics from the University of Ibadan (2014) and a master of statistics, biostatistics option from Hasselt University (2017). He is currently conducting joint PhD research under Prof. dr. Marc Aerts and Prof. dr. Frederik De Laender (Université de Namur). The focus of the PhD research is disentangling and understanding the relationship between trait diversity within species and environmental change.
Koen Pepermans
Koen Pepermans
Koen Pepermans received his master degree in political and social sciences (1994) from the University of Antwerp. He is the Faculty Director of the Faculty of Social Sciences and also the Data Protection Officer at the University of Antwerp. Before his current position he was a teaching and research assistant in the domain of methodology at the same faculty for the master years. As part of this function he taught multivariate statistics, coordinated student research projects in a multitude of topics and was promotor for students thesis’s. During this time he focused mainly on mental health issues and the Minimal Psychiatric Data-system next to other projects related to social aspects of environment and use of space. As part of this function he was a member of the steering group for the Health Survey at the end of the ‘90s. He has provided survey, model and IT expertise to numerous projects both as part of his job at the university and for other universities and organisations through his company KPsoft.
Oana Petrof
Oana Petrof
Oana Petrof received a master degree in biostatistics (2017) from Hasselt University. She started working as a PhD student on October 1, 2017 under the guidance of Prof. Dr. Christel Faes and Dr. Thomas Neyens. She started working on extensions of the standard spatial models in the direction of spatial multilevel models in epidemiology and ecology.
Dr. Eva Santermans
Dr. Eva Santermans
Eva Santermans holds a bachelor degree in mathematics (2010, UHasselt), a master degree in mathematics (2012, KU Leuven) and a PhD degree in sciences: statistics (2016, UHasselt). During her PhD she worked under the supervision of promotor Niel Hens, and co-promotor Marc Aerts. Her research includes the statistical and mathematical modelling of infectious disease epidemiology using social contact data and network analysis. From January 2017 to December 2017 she worked as a senior statistician at Janssen Pharmaceutical Companies of J&J. Since January 2018, she works as a biostatistician at Gálapagos in the Statistical Modelling and Data Science group. She currently joined forces again with her former research group at UHasselt during this exceptional time.
Dr. Andrea Torneri
Dr. Andrea Torneri
Andrea Torneri holds a bachelor degree in Applied Mathematics and a master in Mathematical Sciences. Since 2016, he started a PhD at the University of Antwerp, under the supervision of Prof. Niel Hens, with a focus on the mathematical modelling of infectious disease transmission. His primary interest is to investigate the so-called effective contact process, i.e. the mathematical description of the transition from social interactions to infectious events. To do so, he developed a simulation model based on counting process in which variations in infectiousness and in contact patterns can be implemented. Using this framework, he is currently looking at the impact of pharmaceutical interventions and of behavioral changes on the spreading of infectious diseases.
Prof. dr. Pierre Van Damme
Prof. dr. Pierre Van Damme
Prof. dr. Pierre Van Damme obtained his MD from the University of Antwerp in 1984. He received post-graduate degrees in health and economics, the evaluation of human corporal damage, and a master degree in occupational health. He obtained his PhD in epidemiology and social medicine in 1994 at the University of Antwerp. He is currently full professor and vice-dean of the Faculty of Medicine and Health Sciences at the University of Antwerp where he chaired the Vaccine & Infectious Disease Institute (VAXINFECTIO, University of Antwerp) from 2007 till 2018. He is the honorary chair of the VAXINFECTIO - a consortium of four research units he founded in 2007-2008: the Laboratory of Medical Microbiology, the Laboratory of Experimental Hematology, the Centre of Health Economic Research and Infectious Disease Modelling, and the Centre for the Evaluation of Vaccination (CEV). Recognized as ‘Centre of Excellence’ of the University of Antwerp, it functions as WHO Collaborating Centre for the control and prevention of infectious diseases. Pierre Van Damme founded the CEV in 1994 and is still the director of the CEV.
Pierre Van Damme has authored more than 400 peer-reviewed papers and is on the editorial board of several scientific journals. Professor Van Damme was awarded with the Research Award of the University of Antwerp and with the Belgian Social Medicine Award ‘Jean Van Beneden’ for his work on the introduction of universal hepatitis B immunization programs. In May 2014, he was awarded with the prestigious Bill Marshall award of the ESPID society. In October 2017 he was awarded by the ACRP (Association of Clinical Research Professionals) with the European Outstanding Leadership Award; and end of 2017 with the prestigious Paul Harris Fellowship by the Rotary Foundation of Rotary International. He obtained in 2019 the Balmis distinction Award (Almeria, Spain) and the AHA Antwerp Innovation award.
Since 1994, he has served as the executive secretary of the Viral Hepatitis Prevention Board. In 2016 he participated in the creation of a second expert board on Human Papilloma Virus (HPV), the HPV control and prevention board. His current research projects at the University are focused on the epidemiology and prevention of vaccine-preventable infectious diseases. Since 1985 he has conducted more than 410 vaccine trials. Recently his team has conducted a unique project for the Gates Foundation – a novel vaccine trial in quarantine conditions.
He has been for more than 10 years a regular advisor for national and international organizations. He has been appointed as chairman of the European Technical Advisory Group of Experts on communicable diseases and vaccines for the WHO European Region (ETAGE) (2005-2015). He is a member of the Belgian Royal Academy of Medicine since 2008, and of the board of UNICEF Belgium (2010-2018).
Dr. Yannick Vandendijck
Dr. Yannick Vandendijck
Yannick Vandendijck received a master degree in Statistics at Hasselt University in 2011. He received his PhD in 2015 which covered the use of semi-parametric methods for applications in survey and geostatistical data. He mainly focused on the use of spline methodology, non- and semi-parametric modelling, and geostatistical modelling in his thesis. After his PhD, Yannick was a post-doctoral researcher at Hasselt University. He taught courses on correlated data and spatial epidemiology at Hasselt University, and coordinated the VLIR developmental program of the Master of Statistics at Hasselt University. Since July 2018, Yannick is a senior statistician at Janssen Pharmaceutica, Johnson & Johnson supporting early development clinical trial within infectious diseases and vaccines.
Dr. Joris Vanderlocht
Dr. Joris Vanderlocht
Joris holds a PhD in Biomedical Sciences from Hasselt University and a Masters degree in Biochemistry from the Catholic University of Leuven. He completed his training as a Medical Immunologist at the Maastricht University Medical Center. During this medical training he performed residencies in transplantation immunology at the UCLA in Los Angeles and at the Fred Hutchinson Cancer research center in Seattle. Joris has over 15 years of experience in academic research and is specialized in the fundamental and translational aspects of human immunology. He started his career as a postdoctoral fellow at the Maastricht University Medical Center developing cellular immunotherapy for cancer. Later he managed several diagnostic programs in the clinic, including kidney transplantation, autoimmunity, immune deficiencies and hematological malignancies. Joris currently provides strategic R&D advise to various biotech companies as an independent consultant and functions as senior business analyst in the investment team of Bioqube Ventures (an independent VC-fund). Since 2018 Joris supports the infectious disease modeling group with immunological, methodological and translational research questions.
Dr. Bieke Vanhoutte
Dr. Bieke Vanhoutte
Dr. Bieke Vanhoutte (female) obtained her master’s degree in biomedical sciences in 2013 (UAntwerp). During her PhD research, she investigated novel antibacterial therapies against Pseudomonas aeruginosa and Burkholderia cepacia complex species in in vivo lung infection models. She obtained her PhD degree in 2017. She worked for three years as a project engineer for Pfizer (department environmental monitoring support). In 2020, she started working at the centre for the Evaluation of Vaccination (CEV) at the University of Antwerp.
Prof. dr. Geert Verbeke
Prof. dr. Geert Verbeke
Geert Verbeke is Full Professor in Biostatistics at L-BioStat, one of the divisions of the Department of Public Health and Primary Care of KU Leuven. He chairs L-BioStat and is Head of Department. He received the M.S. degree in mathematics (KU Leuven, 1989) the M.S. degree in biostatistics (U Hasselt, 1992), and earned a Ph.D. in science (biostatistics) from KU Leuven (1995). He is chair of the Department of Public Health and Primary Care of the Group of Biomedical Sciences of KU Leuven (2014-2017), is director of L-BioStat and vice-director of I-BioStat, the Interuniversity Institute for Biostatistics and statistical Bioinformatics between KU Leuven and U Hasselt. Since 2002, he is the representative of the Faculty of Medicine in the Steering Committee of the Leuven Statistics Research Centre (LStat), which he chaired between 2015 and 2017. He has published extensively on various aspects of linear mixed models for longitudinal data analyses. He has held visiting positions at the Gerontology Research Center and the Johns Hopkins University (Baltimore, MD). Geert Verbeke is Past President of the Quetelet Society, International Program Chair for the International Biometric Conference in Montreal (2006), Joint Editor of the Journal of the Royal Statistical Society, Series A (2005-2008), and Co-editor of Biometrics (2010-2012). He has served and serves on a variety of committees of the International Biometric Society. Geert Verbeke is elected Fellow of the American Statistical Association and Elected Member of the International Statistical Institute. He served as international representative on the Executive Board of the American Statistical Association for the periode 2007-2009, and was council member for the Royal Statistical Society, 2013-2016. He received accreditation as professional statistician from the American Statistical Association (ASA) 2010-2016, and received the International Biometric Society Award for the best Biometrics paper in 2006. He edited and authored several books on the analysis of longitudinal data. He taught a large number of short courses for academia, industry, the regulatory authorities, and at scientific meetings. He is the current President (2020-2021) of the International Biometric Society.
Dr. Sarah Vercruysse
Dr. Sarah Vercruysse
Sarah Vercruysse received a master degree in psychology (2007) and a PhD degree in biomedical sciences (2012) from the University of Leuven. From 2007 to 2014 her research entailed behavioural and neuroimaging studies aimed at better understanding why a subgroup of patients with Parkinson’s disease (PD), experience motor blockades or ‘freezing episodes’ during walking and other repetitive movements. The project had a strong multidisciplinary character as it involved collaborations with Neurology, Radiology, and Psychology and Rehabilitation Sciences in Belgium and abroad.
In November 2014, she joined the Center for Statistics at Hasselt University as research manager where she supports CenStat staff in the acquisition of research funding, the collaboration with academic and industrial partners and the commercialization of research results via funding of the Industrial Research Fund (‘IOF’ 50%) and the Methusalem consortium (50%) (PI’s: Prof. Herman Goossens (Antwerp University) and Prof. Geert Molenberghs (Hasselt University).
Frederik Verelst
Frederik Verelst
Frederik Verelst is a Health Economics researcher who obtained his MSc in Economics from KU Leuven in 2015. Since November 2015 he has been employed as a PhD student at the Centre for Health Economics Research and Modelling Infectious diseases (CHERMID) under the supervision of Prof. Dr. Philippe Beutels, where he has been working on an FWO project: “Individual behavior and extra-utilitarian ethics in health economic evaluation: an individual-based modelling approach for measles elimination”. His work focusses on incorporating prevention behavior in relation to infectious disease dynamics, assessing societal preferences with respect to vaccination by means of discrete choice experiments (DCE), determinants of vaccination coverage and the economic evaluation of vaccination programs.
Dr. Maren Vranckx
Dr. Maren Vranckx
Maren Vranckx received a master degree in applied mathematics from the University of Gent (2016). She started her Phd in September 2016 under the guidance of Prof. Dr. Christel Faes. Her research primarily focuses on spatially correlated data. Maren Vranckx teaches courses mathematics and statistics in the Faculty of Applied Economy, the Faculty of Science and Faculty of Medicine and Live Science.
James Wambua
James Wambua
James Wambua obtained a bachelors degree in mathematics from the University of Nairobi, in Kenya in 2014. In 2015, he proceeded to Senegal to undertake a masters in mathematical sciences which he completed in 2016. In 2017, he joined University of Antwerpen to undertake a masters degree in epidemiology and completed in 2019.
Currently, he works as a PhD student under the guidance of Prof. Dr. Niel Hens. His research primary focuses on mathematical modeling of infectious diseases. In particular, exploring the influence of social contact behavior in the transmission dynamics of infectious diseases, and assessing the cost-effectiveness of Varicella and Zoster vaccination programs in Belgium.
Dr. Lander Willem
Dr. Lander Willem
Lander Willem holds a Ba-Ma degree in Bioscience Engineering (2010) from KULeuven and a PhD in Medical Sciences (2015) from UAntwerp. He holds a post-doc fellowship from the FWO to elaborate on individual-based models integrating transmission dynamics, uncertainty and health economic evaluations. In the philosophy of engaging in interdisciplinary research, his work has a particular focus on parameter estimation, social contact patterns, model exploration, and computational efficiency. He is principal investigator of the individual-based model “Stride” to study the interaction between adaptive social behavior and close-contact disease transmission. This C++ simulator is evolving towards a new platform in R based on high-performant transmission modelling and state-of-the-art health economic analyses. He co-authored 2 peer-reviewed Belgian Government Reports and received the “Outstanding Poster Award” at the international “Epidemics4” conference.
Scientific resources
Data dashboards
COVID-19 dashboard Belgium: https://gjbex.github.io/DSI_UHasselt_covid_dashboard/
Survey data UAntwerp: https://corona-studie.shinyapps.io/corona-studie/
Datasets
Publicly available datasets include:
- Social contact datasets: http://www.socialcontactdata.org/
- International confirmed/death/recovered data: https://www.worldometers.info/coronavirus/
- Belgian confirmed cases, deaths, etc by age and other groups, as provided by Sciensano: https://epistat.wiv-isp.be/covid/
- Healthcare pressure in Europe: https://www.covid-hcpressure.org/home/
Papers and preprints
By our own researchers
- "Time between Symptom Onset, Hospitalisation and Recovery or Death: a Statistical Analysis of Different Time-Delay Distributions in Belgian COVID-19 Patients" https://www.medrxiv.org/content/10.1101/2020.07.18.20156307v1
- "Estimating the generation interval for COVID-19 based on symptom onset data" https://www.medrxiv.org/content/10.1101/2020.03.05.20031815v1.full.pdf
- "SOCRATES: An online tool leveraging a social contact data sharing initiative to assess mitigation strategies for COVID-19" https://www.medrxiv.org/content/10.1101/2020.03.03.20030627v2
- "A prospect on the use of antiviral drugs to control local outbreaks of COVID-19" https://www.medrxiv.org/content/10.1101/2020.03.19.20038182v2
- "Indications for healthcare surge capacity in European countries
facing an exponential increase in COVID19 cases " https://www.medrxiv.org/content/medrxiv/early/2020/03/30/2020.03.14.20035980.full.pdf - "A spatial model to optimise predictions of COVID-19 incidence risk in Belgium using symptoms as reported in a large-scale online survey"
https://www.medrxiv.org/content/10.1101/2020.05.18.20105627v1 - "Belgian COVID-19 Mortality, Excess Deaths, Number of Deaths per Million, and Infection Fatality Rates (8 March - 9 May 2020)"
https://www.medrxiv.org/content/10.1101/2020.06.20.20136234v1 - "The COVID-19 epidemic, its mortality, and the role of non-pharmaceutical interventions"
- "A note on macroeconomic impact of “contain & mitigate” SARS-CoV-2 strategies" http://www.simid.be/wp-content/uploads/2020/02/Note-on-macroeconomic-impact-of-flu-like-pandemics. (note for Master students Biomedical Sciences UAntwerp)
- "COVID-19 report on a meta-population model for Belgium: a first status report
- "Modeling the early phase of the Belgian COVID-19 epidemic using a stochastic compartmental model and studying its implied future trajectories" https://www.medrxiv.org/content/10.1101/2020.06.29.20142851v1
- "The impact of contact tracing and household bubbles on deconfinement strategies for COVID-19: an individual-based modelling study" https://www.medrxiv.org/content/10.1101/2020.07.01.20144444v1
- "Belgian Covid-19 Mortality, Excess Deaths, Number of Deaths per Million, and Infection Fatality Rates (8 March - 9 May 2020)" https://www.medrxiv.org/content/10.1101/2020.06.20.20136234v2
- "On the timing of interventions to preserve hospital capacity: lessons to be learned from the Belgian SARS-CoV-2 pandemic" https://www.medrxiv.org/content/10.1101/2020.12.18.20248450v1
By others
A selection of other scientific output important in the field:
H2020 Epipose project
Belgian COVID-19 mortality
This information was used as input for an article in the Belgian newspaper DeMorgen on May 14th, 2020.
By Geert Molenberghs (UHasselt & KU Leuven), Christel Faes (UHasselt), Jan Aerts (UHasselt) and Niel Hens (UHasselt & UAntwerpen)
We are grateful for the ability to make use of publicly available data, graciously made available by Statistics Belgium and Sciensano. We are grateful for comments, suggestions, critical reflections, and other contributions by (alphabetically) Brecht Devleesschauwer, Toon Braeye, Natalia Bustos Sierra, Sophie Quoilin, Francoise Renard, Katrien Tersago, Dominique Van Beckhoven, Nina Van Goethem, Herman Van Oyen, and others. Evidently, any errors in the analysis are the sole responsibility of the authors.
Below, we will provide some insights in the excess mortality in Belgium that is due to COVID-19.
How much of the excess mortality can be explained by COVID-19?
The following graph is based on public data from Sciensano and Statbel, and displays the Belgian mortality in 2020 (red profile), in comparison to annual mortality profiles for 2009 – 2019 (grey profiles), as well as the average of 2009 – 2019 (black profile):
Note that mortality does fluctuate considerably in the first trimester of the year, more so than in other quarters. This results from typical seasonal diseases, such as seasonal flu. The red peak, though, rises sharply above the usual seasonal variation, and at a different time.
Influence of age on COVID-19 mortality
It is well-known that this peak is strongly driven by the older age categories, as is seen from the following graph:
Influence of gender on COVID-19 mortality
As we will see below, mortality is higher in males than female. The graph below, though, seems to suggest the opposite, which is entirely due to the demographic fact that in the older age bracket, as there are more females (approx 200,000) than males (approx 100,000).
Case fatality rate and infection fatality rate
The above concerns the absolute numbers, but what does this look like in relative terms? How many patients reported with COVID-19 actually die? For this, we look at the so-called case fatality rate (CFR):
These case fatality rates, while distressingly high in the older age groups, are low to very low non-existent in the age groups from 0 to 45. The CFR refers to mortality against the background of confirmed cases. The ratio of deaths over confirmed cases was based upon all COVID-19 deaths from March 9, 2020 until May 9, 2020. The confirmed cases as reported on April 27, 2020 were considered, to avoid underreporting of deaths. More sophisticated analyses to take the delay distributions between the various events into account, such as infection, onset of symptoms, hospitalization, and death, show similar results. The horizontal bars represent the average CFR for the population (by sex group), roughly 15% for females and 27,5% for males.
Related to the CFR, the infection fatality rate (IFR) indicates the mortality rate over all people who are infected (including those without symptoms).
For this, we need the real number of cases which is unfortunately not know without testing every single individual. Therefore, it needs to be estimated. This was done using the prevalence estimated from a serological study conducted by Antwerp University (Pierre Van Damme, Heidi Theeten, UAntwerp), with a correction for prevalence in nursing homes. As you can see in the plot above, the IFR is obviously much lower than the CFR, The averages are roughly 1.5% for males and females, but with dramatic differences across age categories. In the oldest age categories, they jump to 8% and 11% respectively, while they are virtually 0% for people under 45 years of age.
Reports of high per capita death rate in Belgium
Belgium has been mentioned internationally for its very high per capita death rate. The following figure partially explains why.
The grey curve shows mortality in a reference year, determined as the average across the years 2009 – 2019. The lower areas (green, orange, blue) give an indication of the slices taken, in reference years, by the major mortality causes: cancer, cardiovascular disease, and respiratory disease (including, among others, influenza induced deaths). We created a synthetic profile by adding COVID-19 mortality to the reference curve, producing the black curve. This synthetic profile corresponds to the hypothetical situation where perfect average mortality would suddenly be superimposed with pure COVID-19 mortality. The real situation is given by the red curve: the properly observed mortality curve for 2020, across all causes. Red and black are similar! It is clear that 2020 was relatively mild in terms of mortality across January and February 2020. What is also clear, and important for us now, is that excess mortality in 2020 coincides with COVID-19 mortality. So, people who died and were COVID-19 positive create a heap in the mortality curve that coincides with overall mortality.
COVID-19 and MS-research
On Thursday 12 March 2020 we said "see you tomorrow" to the colleagues, but that "tomorrow" (yes, Friday the 13th (coincidence or not?)) we didn't go to the office any more. SARS-COV-2 has captured the nation and it is still holding on. That’s why we’re still spending our days at home. Fortunately, with the current technologies and communication tools, a lot of work can be done from home. For example, during the pandemic we started a COVID-19 and MS Global Data Sharing Initiative, which is explained below.
Multiple Sclerosis and COVID-19
Multiple Sclerosis, abbreviated as MS, literally means "multiple scars". It is an autoimmune disease in which the central nervous system (the brain and the spinal cord) is attacked by the body's own cells of the immune system. This leads to scarring, also known as lesions. The clinical signs of MS are very diverse and heterogeneous depending on the anatomical location of the inflammatory lesions. MS is currently still an incurable disease, but therapies are available that suppress the immune system and thus reduce the frequency of attacks. These therapies are called "disease modifying therapies" (DMTs). Compared to people who do not have MS, people with MS are generally more susceptible to infections such as the flu. So, you can understand that people with MS are worried during a pandemic like the one we are experiencing today (caused by an infectious virus).
COVID-19 doesn't need much introduction these days. It's the disease caused by the SARS-COV-2 virus, a coronavirus, that is going around the world at the moment and causes us all to stay "in our pits" (fortunately, we are allowed to get out once in a while). Viruses are tiny little balls that contain genetic material and need humans or animals to spread. The new coronavirus takes its task as a spreader very seriously and has managed to explore the whole world in just a few months. The small culprit of this pandemic has prickly particles on the outside as clearly shown in the most widely used scientific illustration of the moment. Undoubtedly you all know this figure: the grey sphere with red spikes created (only the illustration, not the virus of course) at the Centers for Disease Control and Prevention (https://phil.cdc.gov/Details.aspx?pid=23311). Because of these spikes the virus looks a bit like a crown and that's why it belongs to the family of coronaviruses (Corona is Latin for crown).
Some people are more at risk than others to get COVID-19. Think of people over the age of 65, people suffering from heart disease, but also people with a weakened immune system are seen as risk groups. This includes patients with MS who may or may not receive therapies that suppress the immune system. The arrival of this new virus raises questions for everyone, but especially for people with MS and their physicians. "Are we at greater risk of getting COVID-19?", "Should I still start or continue my current DMT if I get infected with the virus?", "Will COVID-19 infection cause my MS to relapse?" are some examples of questions they have, but they don't know the answers to.
Guidelines for people with MS have been drawn up by MS neurologists and organisations and can be found here. These guidelines will be adapted as soon as new findings are made. These new findings are therefore very important to inform people with MS and their doctors about what to do or not to do during this pandemic. Information provided should not just be based on assumptions (fake news is already being spread enough), but should be based on validated analyses conducted on sufficient data collected during the pandemic. And that is the point to which we contribute with the "COVID-19&MS Global Data Sharing Initiative".
Mission
MS is a relatively rare disease with a prevalence of about 2.3 million people worldwide. As a result, individual countries cannot collect enough data on COVID-19 in people with MS to provide reliable insights. Some countries had already started to collect data on COVID-19 in people with MS (e.g. Italy and the United Kingdom). Given the long-term benefits of harmonising the data collection, the MS International Federation (MSIF) asked whether the MS Data Alliance (MSDA) would be willing to participate in a major project to collect data on MS and COVID-19 on a global scale. Liesbet Peeters, the chair of the MSDA, also a data scientist at the University of Hasselt (BIOMED and the DSI) and not afraid of a challenge, agreed. From then on (we are now mid-March 2020) the project had an extremely passionate project leader. No time to create TikTok videos, bake biscuits or queue at the local supermarket to hoard toilet paper at the Peeters house, because there was a lot of work to be done. The aim of the initiative is to inform the MS community during the pandemic, whereby the information is obtained by analysis on real-world data (data collected during the pandemic). In order to make this possible, MS and COVID-19 data that are collected all over the world are needed to reach a sufficiently large number of data. These data will initially be used to provide initial insights during the pandemic. In this way we want to be able to provide answers to the following questions:
- Are people with MS at greater risk for severe COVID-19 outcomes compared to the general population?
- Is the pattern of risk factors for COVID-19 outcomes similar compared to the general population? (e.g., age, comorbidities... ); Does the severity of MS have an effect on COVID-19 outcomes?
- Is there a difference in COVID-19 outcomes between untreated people with MS and people with MS on DMT drugs?
- Does the type of treatment have an effect on COVID-19 outcomes?
In addition to answers to these questions, we also want to share insights to stimulate and steer future research, because findings in the longer term will also be needed. In-depth analysis of datasets at population level, including medical history and follow-up information, will be needed to answer other research questions such as:
- Are people with MS more susceptible to COVID-19 compared to the general public?
- Are people with MS on a specific drug more susceptible to COVID-19 compared to the general public?
- What is the long-term effect of COVID-19 on the progression of the MS?
- What is the effect of treatment stop or switches on COVID-19 susceptibility and outcomes?
These questions are beyond the scope of our Global Data Sharing Initiative, but we aim share methodological insights gained during our short-term project. Hopefully this will allow us to encourage future research led by others within the MS community.
Generating answers in five steps, lots of goodwill and some coffee
How do you start such an initiative? How do we get the data? What data? Who collects the data and how do the data get to us? Who evaluates the data? Do we have enough coffee?!
The patient is waiting and it is our job to find answers to their questions regarding COVID-19 and MS as quickly as possible. We immediately brainstormed and took action at an unprecedented pace.
There are a huge number of people involved in this initiative to get to what we are aiming for. Everything starts with an extensive network to consult. Fortunately, the MSDA and MSIF have a large number of connections that they can contact, which they did as quickly as possible. There are already a number of initiatives around the world that collect MS data from patients digitally. It varies from initiative to initiative whether this data is collected by physicians, by MS patients themselves or by both. So, it was very important to get these initiatives on board. Mails were sent, phone calls were made and a first meeting was set up to get an idea of the willingness to participate in the Global Data Sharing Initiative. As no one had considered a COVID-19 outbreak this year when applying for scholarships in 2019, there is no funding available specifically to support this project. A serious dose of goodwill and motivation of people with the necessary technical knowledge and ability to participate are therefore essential. Fortunately, the participants of the meeting saw the usefulness and need of the project and there was enough enthusiasm to continue. It had to be decided as soon as possible which variables were important to collect: the so-called “COVID-19&MS core data set” had to be decided on. To this end, a task force was set up that, among other things, examined the literature, but also focused on the existing questionnaires of initiatives in Italy and the United Kingdom, among others. After this we could really get started. Approval was obtained from the ethics committee in no time and, together with a company in legal counselling, lawyers and data protection officers, we looked at how we could make everything happen as quickly as possible and, above all, legally.
The project can be divided into 5 phases, which are shown in the figure below and also described below.
1. Data collection
The collection of data can be done in two ways:
- Via national registers and cohorts (left on the figure): these are the initiatives that in any case already collect MS data and have already been briefly mentioned above. These initiatives will use their own standard procedures during the Global Initiative. The Registries are therefore also responsible for local ethical and privacy issues involved. These registries collect data reported by MS patients themselves and/or by their treating physicians. They are asked to implement the COVID-19&MS core dataset to the possible extent. Of course, the registries remain the owner of their data.
- Via direct input into a central platform, the "fast module" (right on the figure): We encourage everyone to share data via the existing registers, but if for some reason (e.g. because they don't have time to go via a register) patients or clinicians were not able to do so, it is also possible via the Fast Module. This in turn concerns data that is entered by people with MS as well as healthcare providers.
The reason why we prefer that the data collection is done by the registers, is because the data collection through the "Fast Module" does not offer long-term perspectives. These data are fully deidentified and can never be linked again to the patient in question. The Fast Module also contains only the questions of the COVID-19&MS core dataset while the questionnaires of the registers contain many more questions by default and the patient data often go back further in time (medical history).
2. Sharing the collected data
In order to get a large amount of data, it is necessary that the data collected in different countries is also shared and ends up in one central place. The registers will create an export, a "dump" of the COVID-19 dataset. This dump (deidentified data) will be imported into the central platform that was kindly provided by QMENTA. This can be done in different ways and the registries get support from the MSDA and QMENTA where necessary. Each data custodian will also have access to their data in the platform.
We advise the data custodians to create this subset of data using a transformation code that will allow updates of the dump on a regular basis (preferably once a week), because we do not work with a static database in this project. Indeed, every week (if possible) we ask the custodians to upload new data. So, the database grows every week.
3. Data cleaning and preprocessing
The data custodians together with a so-called "data wrangling team" will clean up the data (not that they are dirty, but believe me: data cleaning is necessary) and "pre-processes" so that the data has the right form in order that downstream analyses can be performed.
4. Data analysis and 5. Feedback of results
The data of all registers and also the data of the fast modules come together in one central platform. Data from each register will be labelled in such a way that they can be linked back, in case this should be necessary. All combined data (from the registers and the fast modules in the central platform) will be checked and analysed by an analysis task force consisting of epidemiologists/biostatisticians in order to come to initial insights. As soon as a certain threshold of reliability and accuracy is reached, the platform will be made interactive so that people with MS, clinicians and researchers also have access. They will also be able to view and query these data/results.
So, as soon as the accuracy and reliability of the data is high enough, the platform will become interactive and data custodians, patients, doctors and researchers will have access to the data. These data are deidentified (outside the of scope of the GDPR) and will remain in the platform until the analyses are completed (provisionally until 31 December 2020). After that, they will be removed from the platform and return to the custodians.
One-month time: all the difference in the world
A lot can happen and change in a short time. From one day to the next, for example, you end up in a lockdown world and from one day to the next you get involved in a project of a size we've never stood for before. After one month we had made already a lot of progress. There are currently 8 registers/cohorts who have signed a Data Transfer Agreement and who (will) officially share data in the central platform. There are 15 other initiatives that also collect and plan to share data. In total (including the fast module) 1233 patients and 120 clinicians already shared data in the central platform on May the 6th.
Because it was not possible for a number of registries to sign the Data Transfer Agreement (due to local privacy issues) and they will therefore not be able and allowed to share patient data in the platform, we have devised an alternative in which they share insights instead of patient data. Our team of analysts and data wranglers have written R- and Python scripts that the registers can run on their collected data. Instead of the data itself, they will share insights in the form of "counts". This is what is called a federated system. The gathering of data at one single point is called a centralized system. In the federated system the data does not leave the register. Therefore, it is outside the scope of the GDPR.
Who does what? #DataSavesLives
To recap: in our project we collect as much patient data as possible on MS and COVID-19 during the pandemic in order to be able to analyse these data and come to reliable insights. These insights will help MS patients and their physicians to make decisions during the COVID-19 pandemic.
It may sound simple, but there is a lot involved. Such a project can only be successful if many people work together. Let's sum up who is involved.
MSIF is a global network of 48 MS organisations, people with MS, volunteers and staff from all over the world. MSIF aims to inspire, mobilise and bring the world together (but at least 1.5m away these days 😉) in order to improve the quality of life for all those affected by MS. The ultimate goal is to achieve a world without MS. Worldwide there are about 2.3 million people living with MS, but a large proportion of these people have little or no access to support, which, together with sharing accurate information, is vital for people with MS and their families. MSIF aims to increase awareness of the disease. They also support scientific research to improve MS treatments.
The MSDA is a new player in the field that has only just been launched in November 2019. It is an independent multi-stakeholder initiative that operates under the umbrella of the European Charcot Foundation (ECF) in which ECF acts as the legal entity. In turn, ECF is an independent non-profit organisation with the aim of advancing MS research.
The stakeholders of the MSDA are regulatory authorities, people with MS, patient organisations, data custodians, industry partners, physicians and researchers. As its name suggests, the MSDA focuses on data. We believe that the care of people with MS can be improved by using existing data (real-world data). Together with its partners, the MSDA tries to make people aware of the principle that the use of real-world data is of great importance in research. This real-world MS data should therefore also be accessible and collected in a reliable and transparent way.
The daily coordination of the COVID-19&MS project, management, communication and legal council is led and carried out by Liesbet Peeters (UHasselt and chair of the MSDA), Nick Rijke (MSIF), Lotte Geys (UHasselt, MSDA), Gunther Meyer (external lawyer), Jan Samyn (ECF, MSDA), Clare Walton (MSIF), Victoria Gilbert (MSIF) and Margo Heremans (ECF, MSDA).
QMENTA is the company that has developed and kindly provided the central platform where the data comes together and is analysed for the Global Data Sharing Initiative.
In pre-COVID-19 times they mainly focused on storage, processing and visualization of medical imaging (MRI) in the brain. They offer state-of-the-art medical imaging algorithms in a way that accelerates the development of new therapies for neurological diseases by using their platform. The Q in QMENTA stands for "quality", but also "quantity", which refers to the large amount of information that can be extracted from complex MRI images. "Menta" comes from the Latin mentis (the mind) and refers to the focus on the brain.
Landon McKenna, Nikola Lazovski and Paulo Rodrigues are responsible for the development of the central platform for the global initiative and work around the clock to keep everything on track.
The Data Wrangling Task Force ensures that the data collected by the registries/cohorts are properly imported into the central platform, and also ensures that the data in the platform is "cleaned up" and pre-processed in such a way that it can be used for analysis. This task force consists of Tina Parciak (University of Göttingen, MSDA), Luc De Raedt, Clément Gautrais, Yann Dauxais (KU Leuven) and Lars Forsberg (Karolinska Institute in Sweden).
The Analyses Task Force consists of experts in epidemiology and biostatistics. They have drawn up a list of hypotheses, research questions and an analysis plan at the start of the project. During a short hackathon, they will review the first analyses together and decide when the platform will have sufficient high-quality data to proceed and make the platform interactive. This task force consists of Jan Hillert and Tim Spelman (Karolinska Institute), Tomas Kalincik and Steve Simpson-Yap (Melbourne University), Yves Moreau and Edward De Brouwer (KU Leuven), Ashkan Pirmani (KU Leuven and University Hasselt), and Gilles Edan (ECF).
The MS Registers/cohorts that currently (on 7 May 2020) have committed to actively participate in the project are listed in the table below.
Currently participating COVID-19 in MS data collection initiatives
| Initiatief dat COVID-19 & MS verzamelt | Data gerapporteerd door patiënten | Data gerapporteerd door artsen |
|
Ja |
Nee |
|
|
Ja |
Nee |
|
|
Nee |
Ja |
|
|
Bulgarian SmartMS COVID-19 dataset |
Ja |
Ja |
|
Cleveland Clinic MS COVID-19 Registry |
Ja |
Ja |
|
Ja |
Nee |
|
|
French COVISEP |
Nee |
Ja |
|
German MS Register, by the German MS-Society COVID-19 survey |
Ja |
Ja |
|
HOLISM |
Ja |
Nee |
|
Ja |
Ja |
|
|
Ja |
Nee |
|
|
Nee |
Ja |
|
|
MSBase COVID-19 Substudy |
Nee |
Ja |
|
NeuroTransData |
Ja |
Ja |
|
Nee |
Ja |
|
|
REDONE |
Nee |
Ja |
|
Nee |
Ja |
|
|
Nee |
Ja |
|
|
Nee |
Ja |
|
|
The Spanish MS Registry |
Nee |
Ja |
|
Ja |
Ja |
Currently, there are 11 registries/cohorts collecting (or preparing to collect) patient-reported data and 18 registries/cohorts collecting (or preparing to collect) clinician-reported data. Abbreviations: ABEM: Brazilian Multiple Sclerosis Association; AMSLS: Australian MS Longitudinal Study; COVID-19: Coronavirus Disease 2019; COViMS: COVID-19 infections in MS Database; COVISEP: part of French MS Registry collecting data on COVID-19; CRF: case report form; EMA: Esclerosis Multiple Argentina; HOLISM: Health Outcomes and Lifestyle in a Sample of People with Multiple Sclerosis; LEOSS: Lean European Open Survey on SARS-CoV-2 Infected Patients; MS: Multiple Sclerosis; MuSC: Multiple Sclerosis and COVID-19; NTD: Neurotransdata; REDONE: Brazilian Registry of multiple sclerosis and neuromyelitis optica spectrum disorders; RELACONEM: part of RelevarEM registry that will collect the data of COVID-19.
Keep up to date?
On the website of the MSDA and MSIF you can find a large amount of extra information about the COVID-19&MS Global Data Sharing Initiative. If you are interested, you can subscribe to the MSDA and/or MSIF newsletter.
This video summarizes the project visually and briefly. Feel free to share it.
Education
Are you interested in the quantitative aspects of science behind the COVID-19 pandemic and other infectious diseases, and do you possess a relevant bachelor or master degree, you might consider taking the Master of Statistics and Data Science program.