
The molecular speedometer
Biomolecules hide a wealth of information in the way they move about! We specialize in fluctuation spectroscopy methods for quantifying biomolecular diffusion and binding processes.


Fluorescence Fluctuation Spectroscopy
A family of methods that allow quantifying molecular properties such as concentrations, mobility, stoichiometry, interaction affinities of diffusing molecules at equilibrium is called fluorescence fluctuation spectroscopy.
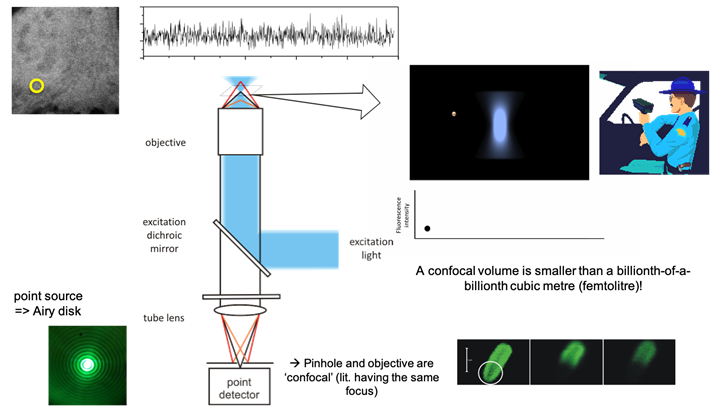
Fluorescence Correlation Spectroscopy
The simplest implementation is fluorescence correlation spectroscopy (FCS), where fluorescence signals from freely diffusing molecules is recorded on a confocal microscope (without image scanning). The resulting time trace is analyzed via autocorrelation, which then informs on diffusion rates and concentration.
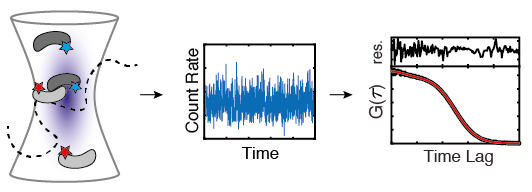
Illustration of FCS. Adapted from Schrimpf et al., 2018.
Raster Image Correlation Spectroscopy
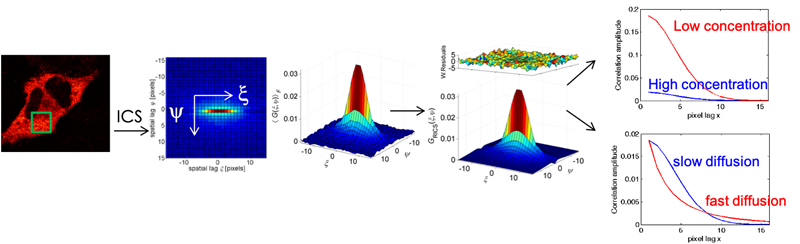
Image correlation spectroscopy extends FFS analysis to imaging data. With Raster ICS (RICS), for example, mobility and concentration information is obtained from confocal laser scanning microscopy images.
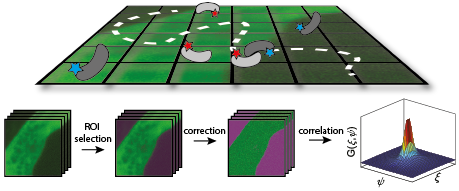
Illustration of RICS. Adapted from Schrimpf et al., 2018.
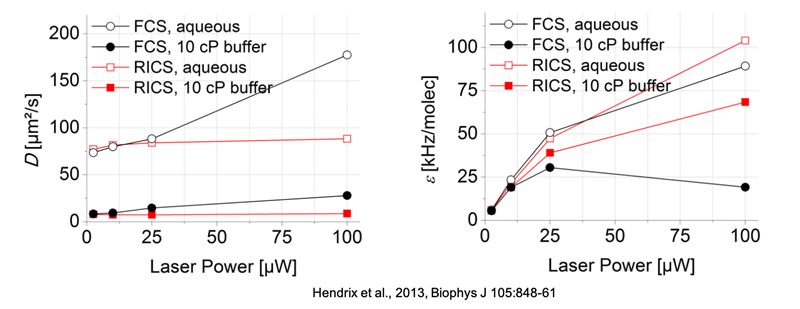
RICS is often better than FCS when using genetic fluorophores such as fluorescent proteins. You can assess the mobility of labeled molecules much more precisely, and at much higher signal levels with RICS! This example is a comparison of Venus using FCS versus RICS in a viscous buffer.
This is an exemplary dataset illustrating the effect of different diffusion rates and concentrations on the shape of correlation functions. It's really that easy, one minute of measurements and you know how fast your molecules move, whether they interact with immobile structures and what their molar concentration is!
Your own analyses at the click of a button!
Our free, user friendly and documented software will make your diffusion and binding analyses easy.

Segmented ICS analysis
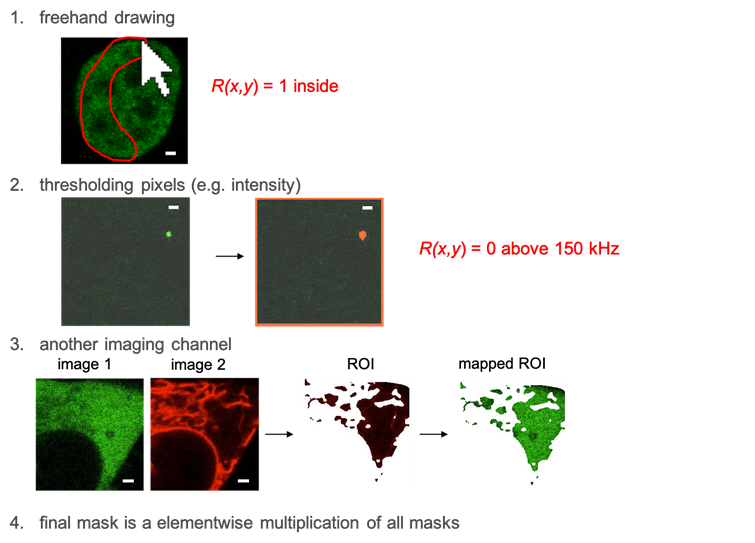
We've adapted the original RICS Fast-Fourier Transform algorithm to allow focusing analyses to small regions-of-interest in the sample. It's possible by simply drawing an ROI, segmenting on the basis of local image intensity, or by imaging a fiducial marker in another imaging channel.
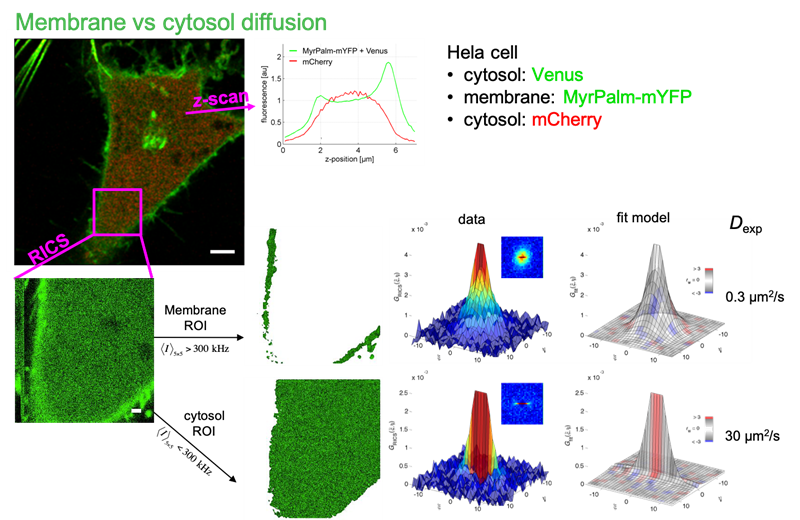
This is an example where we carry out a RICS analysis in both the cytosol and the cell membrane, from the same dataset! Less work, more results!
Arbitrary-region ICS (ARICS) even allows mapping molecular properties in e.g. a biological structure, providing detailed insights in the workings of complex biological machineries.
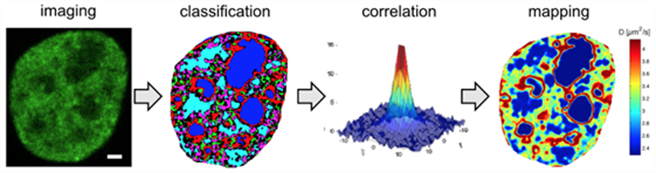
Illustration of ARICS. Adapted from Hendrix et al., 2016.
Spectrally resolved RICS
In multicolor imaging, spectral bleed through causes the more red-shifted fluorescence images to contain phantom signals from the blue-shifted fluorophores. This spill-over artifact renders quantitative multicolor RICS challenging.
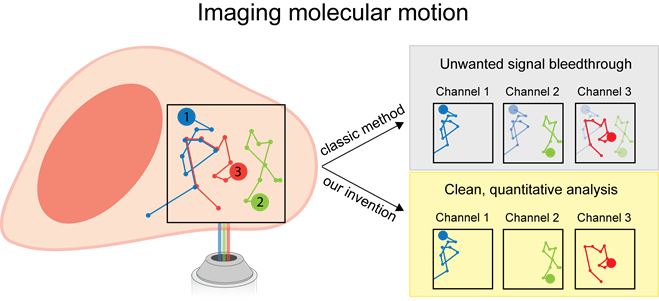
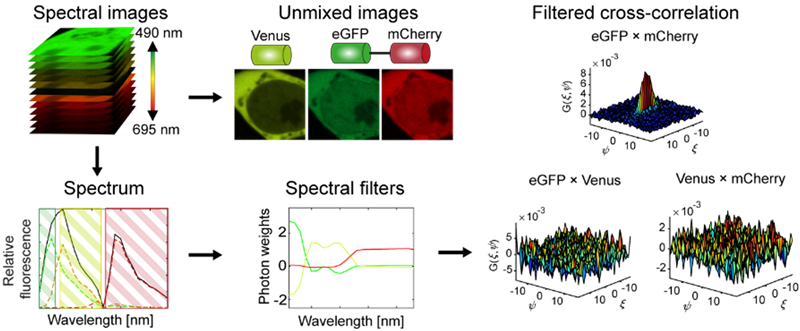
Therefore we developed so-called spectrally resolved RICS, by using the spectral signature of fluorophores as a means to unmix the signals during correlation analysis (patent protected WO/2019/138028). Spectral RICS readily allow 3- and more-color RICS analysis, enabling the investigation of complex ternary structural assemblies! This is a conceptual example of 3-color RICS.
ZEISS Spectral RICS
Zoom in on what biomolecules are actually doing inside cells! Thanks to a software wizard workflow and automated analysis, multicolor crosstalk-free raster image correlation spectroscopy has never been easier!

Comparison of methods for studying diffusion
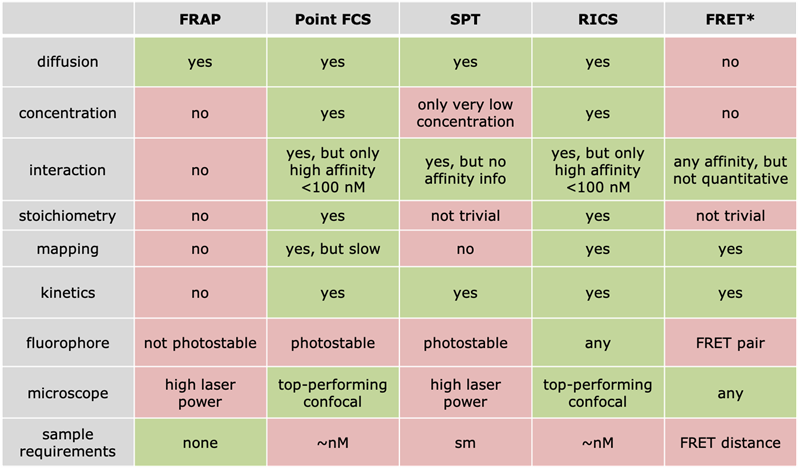
* for comparative purposes.